Need to chart some simple data and have an input location (Google Sheets) that populates an interactive cloud-based chart.
- Status: Closed
- Prize: $50
- Entries Received: 2
- Winner: MoohHHooM

Contest Brief
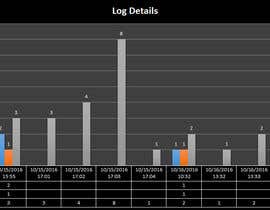
Need to chart some simple data and have an input location (Google Sheets) that populates an interactive cloud-based chart. See attached for data. I just need to be able to add this data into a google sheet each day (or excel if that is easier) and have it output as a dynamic web-based chart where the end user can interact and select from the very limited options (date, source, & project). Ideally, the chart would default to the last 7 days of data with the option to open up the time range more. Need to also be able to select "Project" and see only the Time values for that project. Each view would sum the total "time" for all elements displayed within the view. For a knowledgeable person, this would take about 2 hours. Bonus points for adding default views that are day, week, month views embedded in the web page. (a dashboard of sorts, where one of the views is customizable through the filters mentioned above). FYI, the "Time" values in the data are page load times that are being tracked (not the time of day). The "Date" actually includes date and time. We want the charting to be chronological by the date field.
Recommended Skills
Public Clarification Board
How to get started with contests
-

Post Your Contest Quick and easy
-

Get Tons of Entries From around the world
-

Award the best entry Download the files - Easy!